Many straight lines can be drawn through the data points, but:
The best fit line is the one that minimizes the overall prediction error.
This line represents the true relationship between X and Y as closely as possible.
Regression Equation (Correct Form)
Where:
- ŷ → predicted output
- x → independent variable
- β₀ → intercept
β₁ → slope (weight of x)
Alternative Notations
In many research papers and textbooks, the same equation is written as:
All represent the same concept, just different notation.
Intercept (β₀ or θ₀)
Definition
Intercept is the value of ŷ when x = 0.
It is the point where the best fit line cuts the y-axis.
Mathematical Meaning
So, β₀ = intercept.
Real-World Meaning
In real life, x = 0 may or may not be practical.
Still, the intercept is required to position the best fit line correctly.
Example:
If predicting salary using experience,
Experience = 0 years → predicted salary = intercept.
Special Case: Intercept = 0
- Sometimes, the best fit line passes through the origin.
- In that case:
- Equation becomes:
Graphical Interpretation
X-axis → independent variable
Y-axis → dependent variable
Intercept shows where the line meets the Y-axis
Slope shows the rate of change of ŷ with x
Understanding Slope in Linear Regression
In linear regression, the slope tells us how the output changes when the input changes.
Mathematically, slope is defined as:
This means:
Change in y with respect to change in x
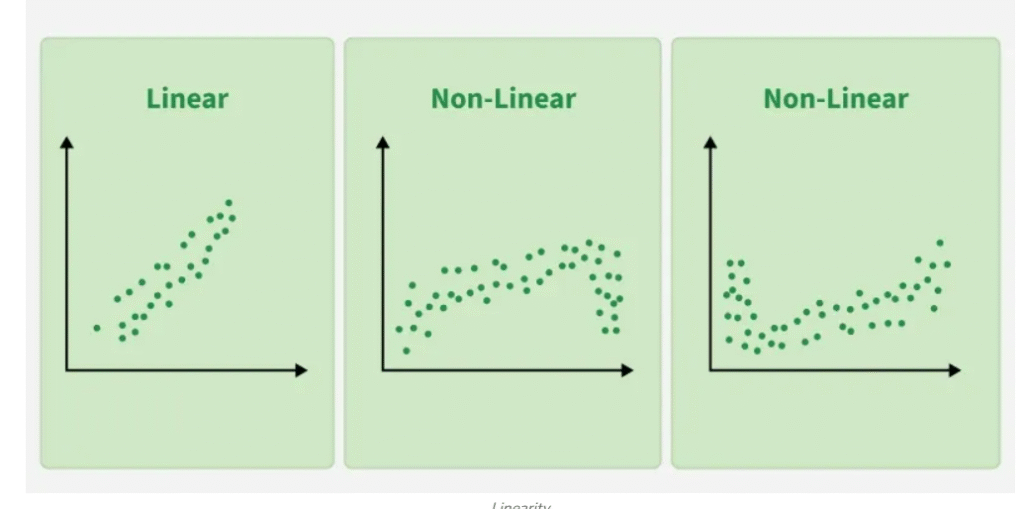
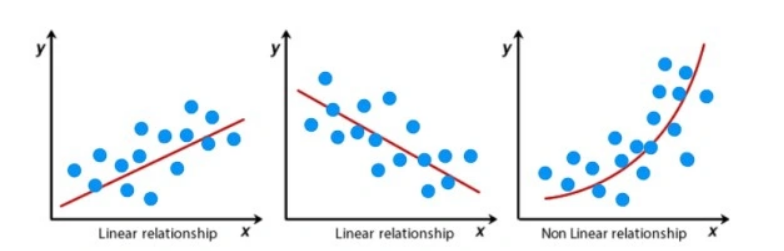
Slope for a Straight Line
For a straight line, the slope is constant.
This means:
The rate of change remains the same for all data points
No matter where we measure it, the slope does not change
This is why linear regression works only when the relationship between variables is linear.
In calculus, slope is written as:

This represents:
How much y changes when x changes slightly
For a straight line:
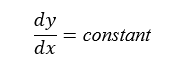
So, in linear regression, the slope remains the same for the entire dataset.
Slope for a Curve
In contrast:
- For a curve, the slope changes at different points
- Hence, slope is not constant
That is why linear regression cannot fit curved data well.
Hence to apply linear regression there needs to be a linear relationship between the dependent variable and independent variable(s).
So, Linear Regression Hypothesis Function
The prediction function in linear regression is called the hypothesis function.
It is written as:
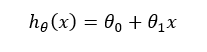
Why Do We Need θ₀ and θ₁?
To draw the best fit line, we must find the best values of: