
Classification metrics
Suppose I build a machine learning model.
It gives predictions.
How do I know if my model is GOOD or BAD?
- By checking accuracy
- By seeing correct predictions
Is being correct most of the time always enough?
Why Accuracy Alone Fails
Imagine a hospital uses an AI model to detect a serious disease.
- Total patients = 1000
- Actually sick = 10
- Healthy = 990
Model says:
Everyone is healthy
How many predictions are correct?
- Correct = 990
- Accuracy = 99%
his model has 99% accuracy…
but it FAILED to detect even one sick patient.
So accuracy alone cannot tell us the full story.
High accuracy ≠ Good model
We don’t just want to know how many predictions were correct,
we want to know HOW the model is making mistakes.
This is why we need Classification Metrics.
WHY Classification Metrics Exist
Classification metrics help us:
- Measure model performance properly
- Understand different types of errors
- Decide whether the model is useful in real life”
Why We Need Classification Metrics
- Accuracy alone can be misleading
- Different mistakes have different impact
- Some problems need confidence, some need coverage
- Real-world decisions depend on error type
To evaluate any machine learning model,
we use something called Performance Metrics.
Performance metrics are numerical measures
that tell us how well a model is performing.
Performance Metrics = Model Evaluation Measures
For classification problems, we use classification performance metrics.
What Exactly Do Classification Metrics Measure?
Classification metrics do NOT only count correctness.
They measure:
- How many predictions were correct
- How many positives were detected
- How many false alarms occurred
- How many real cases were missed
Classification metrics analyze model errors in detail
Before calculating any metric,
we must first understand what kinds of predictions a model makes.
For that, we use something called the Confusion Matrix.
All classification performance metrics
are derived from the confusion matrix.
First we understand how predictions are classified
then we measure how good those classifications are.
When we build a classification model, its job is simple:
- Predict YES or NO
- Predict Spam or Not Spam
- Predict Sick or Healthy
- Predict Pass or Fail
Once predictions are made, a natural question arises:
How good is our classification model?
When we build a classification model, its job is simple:
- Predict YES or NO
- Predict Spam or Not Spam
- Predict Sick or Healthy
- Predict Pass or Fail
Once predictions are made, a natural question arises:
How good is our classification model?
But after predictions are made, a very important question arises:
How good is our model?
At first glance, the answer seems easy:
“Just check how many predictions are correct.”
This idea leads to accuracy
But this is where the problem starts.
Spam Filter Example (Very Important)
Suppose your spam filter checks 100 emails.
At first glance:
- 95 emails are classified correctly
- Accuracy = 95%
Sounds great, right?
Now think carefully.
Case 1: Most Emails Are Spam
Out of 100 emails:
- 90 are actually spam
- 10 are legitimate
Model prediction:
- Marks all 100 emails as spam
Result:
- Spam emails caught → 90 (correct)
- Important emails blocked → 10 (wrong)
Accuracy:
But ask yourself:
Would you use a spam filter that blocks important emails?
No.
Case 2: Very Few Spam Emails (More Realistic)
Out of 100 emails:
- 5 are spam
- 95 are legitimate
Model prediction:
- Again marks all 100 as spam
Result:
- Correct = 5
- Wrong = 95
Now the model is clearly terrible.
What Did We Learn?
Accuracy only answers:
“How many predictions were correct?”
But it does NOT answer:
- What kind of mistakes were made
- Whether those mistakes are acceptable
So the real question is:
What type of mistakes is the model making?
This is why we need other classification metrics.
Confusion Matrix – The Foundation of All Metrics
Before calculating any metric, we must first understand how predictions are classified.
This is done using the Confusion Matrix.
What Is a Confusion Matrix?
A confusion matrix is a 2×2 table that compares:
- Actual values (ground truth)
- Predicted values (model output)
It shows all possible outcomes of classification.
The Four Outcomes
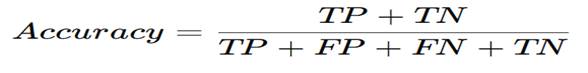
| Prediction | Actual Positive | Actual Negative |
| Predicted Positive | True Positive (TP) | False Positive (FP) |
| Predicted Negative | False Negative (FN) | True Negative (TN) |
Let’s understand each clearly:
- True Positive (TP)
Model says YES, reality is YES
Example: Sick person correctly identified - True Negative (TN)
Model says NO, reality is NO
Example: Healthy person correctly cleared - False Positive (FP)
Model says YES, reality is NO
Example: Healthy person marked sick (false alarm) - False Negative (FN)
Model says NO, reality is YES
Example: Sick person marked healthy (dangerous)
Every classification metric is calculated using TP, FP, FN, and TN.
Accuracy – The Simplest Metric
What Is Accuracy?
Accuracy measures:
How many predictions were correct overall
Example: Student Pass/Fail Prediction
- Total students = 100
- Correct predictions = 87
Accuracy = 87%
Meaning:
The model is correct 87% of the time.
When Accuracy Works Well
Accuracy is useful when:
- Dataset is balanced
- Both types of errors are equally serious
When Accuracy Lies 🚨
Fraud Detection Example
- 1000 transactions
- Only 10 are fraud
- Model predicts all as normal
Accuracy = 99%
But:
- Fraud detected = 0
A 99% accurate model that catches zero fraud is useless.
Precision
Problem: Restaurant Review Sentiment
Classes:
- Positive → YES
- Negative → NO
Step 1: What the MODEL Predicted
“Model predicts 80 reviews as POSITIVE”
So for these 80 reviews:
- Model said YES (Positive)
Step 2: What is the REALITY for These 80 Reviews
Out of these 80 predicted-positive reviews:
- 70 are actually Positive
- 10 are actually Negative
Step 3: Now Assign TP / FP / TN / FN
Case A: 70 reviews
- Predicted: Positive (YES)
- Actual: Positive (YES)
True Positive (TP = 70)
Case B: 10 reviews
- Predicted: Positive (YES)
- Actual: Negative (NO)
This is a False Positive (FP = 10)
Why?
Because:
- Model said YES
- Reality was NO
This is a false alarm.
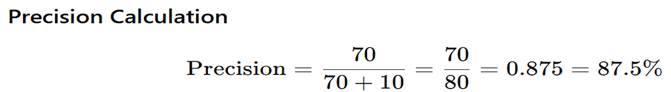
Interpretation (Very Important)
When the model says a review is Positive,
it is correct 87.5% of the time.
This means:
- The model’s positive predictions are mostly trustworthy
- Only a few false alarms exist
5. Another Numerical Example: Loan Approval (High-Risk Case)
Situation
A bank uses an ML model to approve loans.
Model Output
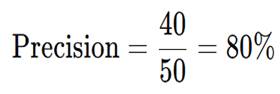
- Predicts 50 loan applications as Approved
Reality
- 40 applicants are actually good customers
- 10 applicants are risky and default later
So:
- TP = 40
- FP = 10
Precision
Meaning in Real Life
When the model approves a loan,
there is an 80% chance the customer is trustworthy.
The 20% false approvals can cause:
- Financial loss
- Legal trouble
- Reputation damage
That’s why precision is critical in loan approval systems.
Where Precision Matters Most (Very Important)
Precision is crucial when false positives are costly.
Examples:
- Spam filters
Marking an important email as spam is dangerous - Loan approval
Approving a bad loan causes financial loss - Product recommendations
Showing irrelevant products annoys users - Offensive content detection
Flagging innocent posts can cause serious issues
In all these cases:
It is better to say NO than to say YES incorrectly
100% Precision but Still a Bad Model
Step 1: Actual Situation (Reality)
Suppose we have 100 emails:
- 50 are actually spam
- 50 are legitimate
So there is a lot of spam in reality.
Step 2: Model’s Behaviour (Extreme & Lazy Model)
Now imagine a very conservative spam filter that behaves like this:
“I will mark an email as spam only if I am 100% sure.
Otherwise, I will say it is legitimate.”
So what does it do?
- It predicts ONLY 1 email as spam
- That email is actually spam
All other emails (99 emails):
- Are predicted as legitimate
- Even though many of them are spam
Step 3: Now Count TP, FP, FN, TN
For the ONE predicted spam email:
- Predicted: Spam
- Actual: Spam
True Positive (TP = 1)
For predicted spam emails:
- No wrong spam predictions
False Positive (FP = 0)
So far:
TP = 1
FP = 0
Step 4: Precision Calculation
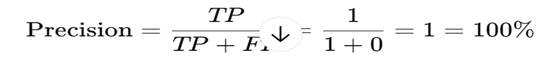
So mathematically:
Precision = 100%
And this is correct mathematically.
Then Why Is the Model BAD?
Because now look at what it MISSED.
Actual spam emails = 50
Spam detected = 1
So:
- 49 spam emails were missed
- Inbox is full of spam
- Users are unhappy
This means:
- Recall is extremely low
- Model is practically useless
Precision looks ONLY at predicted YES cases.
It completely ignores missed YES cases.
That’s why:
- Predicting very few YES → precision goes up
- But usefulness goes down
Precision answers:
“When the model says YES, is it correct?”
Precision is a classification metric that measures the correctness of positive predictions. It is defined as the ratio of true positives to the total number of predicted positives. Precision is important when false positive errors are costly.
Final Takeaway
- High precision → Few false alarms
- Precision focuses on quality, not coverage
- Precision alone can be misleading
- Must be used together with Recall
Precision tells us how reliable YES predictions are.
Now let us see Recall, which tells us how many real YES cases were found.
What Is Recall?
Recall tells us how many actual YES cases the model was able to detect.
More clearly:
Out of all the cases that were actually positive,
how many did the model correctly identify?
Recall focuses on:
- Coverage of positives
- Missed cases
3. Recall Formula (With Meaning)
Where:
- TP (True Positive) = Actual YES, predicted YES
- FN (False Negative) = Actual YES, predicted NO (missed case)
So:

4. Numerical Example 1: Disease Detection (Classic Example)
Situation (Reality)
Suppose:
- 100 patients are actually sick
Model Prediction
- Model correctly identifies 85 sick patients
- Model misses 15 sick patients
So:
- TP = 85
- FN = 15
Recall Calculation
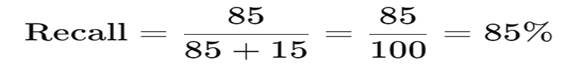
Interpretation (Very Important)
The model detects 85% of the sick patients
but misses 15%, who may not receive treatment.
In medical problems:
Missing a sick patient can be dangerous or fatal.
5. Numerical Example 2: Spam Filter (Easy to Visualize)
Reality
Out of 100 emails:
- 40 are actually spam
- 60 are legitimate
Model Prediction
- Correctly detects 30 spam emails
- Misses 10 spam emails (go to inbox)
So:
- TP = 30
- FN = 10
Recall Calculation
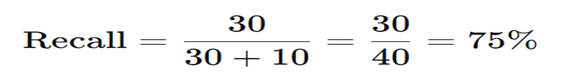
Meaning
The spam filter catches 75% of spam,
but 25% of spam still reaches the inbox.
Low recall here means:
- Users still see a lot of spam
- Spam filter is weak
7. Where Recall Matters the MOST (Critical Section)
Recall is crucial when missing a positive case is very dangerous.
Examples:
- Medical diagnosis
Missing disease = patient suffers - Cancer screening
Missing cancer = life-threatening - Fraud detection
Missing fraud = financial loss - Security systems
Missing threats = safety risk
In such systems:
Better to raise some false alarms
than to miss real danger.
8. Problem With Only High Recall (Very Important)
Now comes the most important learning.
Extreme Case: 100% Recall but Still a Bad Model
Imagine a medical test that:
- Predicts EVERYONE as sick
Reality:
- 100 patients are sick
- 9,900 are healthy
Model prediction:
- All 10,000 predicted sick
So:
- TP = 100
- FN = 0
Recall
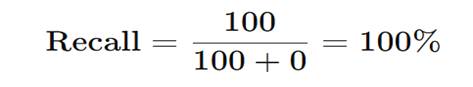
Perfect recall!
But what happened?
- 9,900 healthy people got false alarms
- Hospitals overflow
- Panic everywhere
So:
High recall alone does NOT mean a good model.
9. Why Recall Alone Is Not Enough
Recall does NOT tell us:
- How many false alarms occurred
- Whether YES predictions are trustworthy
So a model can:
- Catch all positives
- But still be unusable
That’s why recall must be balanced with Precision.
Out of all actual YES cases, how many did we find?
Recall is a classification metric that measures the ability of a model to identify all actual positive cases. It is defined as the ratio of true positives to the total number of actual positives. Recall is important when missing a positive case is costly or dangerous.
Final Takeaway
- High recall → Few missed cases
- Recall focuses on coverage, not accuracy of YES
- High recall alone can cause many false alarms
- Recall must be used with Precision
Precision tells us how reliable YES predictions are.
Recall tells us how many real YES cases were found.
Now let us combine both using F1-Score.
F1-Score – Balancing Precision and Recall
Why Do We Need F1-Score?
So far, we learned two important metrics:
- Precision → When the model says YES, is it correct?
- Recall → Did the model find all the YES cases?
- Now, the questions are:
- What if a model has high precision but low recall?
What if a model has high recall but low precision?
So we need ONE metric that:
- Considers both precision and recall
- Penalizes models that do well in only one
- Rewards balanced performance
This is why F1-Score exists.
What Is F1-Score? (In Simple Words)
F1-Score is a single number that tells how well a model balances precision and recall.
In other words:
A model gets a high F1-Score only if BOTH precision and recall are high.
If either one is low:
- F1-Score becomes low
F1-Score Formula
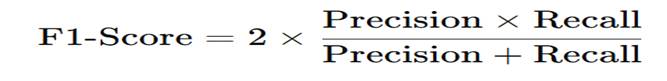
This is called the harmonic mean of precision and recall.
Numerical Example 1: Balanced Model (Good Case)
Model Performance
- Precision = 90%
- Recall = 80%
F1-Score Calculation
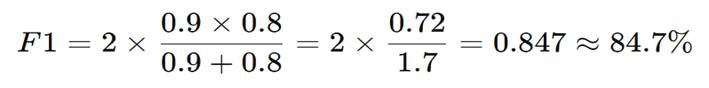
Interpretation
The model is reliable (high precision)
AND
The model covers most positives (good recall)
So the F1-Score is high.
Numerical Example 2: High Precision, Low Recall (Bad Case)
Model Performance
- Precision = 95%
- Recall = 10%
This happens when:
- Model predicts YES very rarely
- Almost never gives false alarms
- But misses most real cases
Simple Average (MISLEADING)

Looks okay… but it’s NOT.
F1-Score

Interpretation
Even though precision is very high,
the model is terrible at finding real cases.
F1-Score exposes this clearly.
Numerical Example 3: High Recall, Low Precision (Also Bad)
Model Performance
- Precision = 20%
- Recall = 95%
This happens when:
- Model predicts almost everything as YES
- Catches nearly all positives
- But raises many false alarms
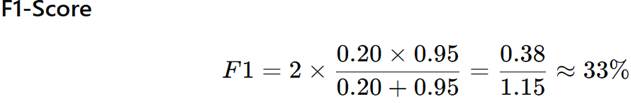
Interpretation
Catching everything is useless
if most predictions are wrong.
Again, F1-Score shows the truth.
hink of F1-Score like a balance scale:
- Precision on one side
- Recall on the other side
If one side is very low → balance breaks → low F1
Why Harmonic Mean Is Used (Very Important)
Simple Explanation
- Arithmetic mean allows cheating
- Harmonic mean does not
Example:
| Precision | Recall | Average | F1 |
| 95% | 10% | 52.5% | 18% |
| 90% | 90% | 90% | 90% |
F1-Score punishes imbalance and rewards balance.
Where F1-Score Is MOST Useful
F1-Score is ideal when:
- Dataset is imbalanced
- Both false positives and false negatives matter
- You need one number to compare models
Common Uses:
- NLP (spam detection, hate speech)
- Medical screening (general assessment)
- Fraud detection
- ML competitions
10. Where F1-Score Is NOT Ideal
F1-Score may not be the best choice when:
- Only precision matters (e.g., loan approval)
- Only recall matters (e.g., cancer screening)
In such cases:
Focus on the more important metric directly
F1-Score answers:
“Is the model good at both being correct and not missing important cases?”
F1-Score is a classification metric that combines precision and recall using their harmonic mean. It provides a balanced evaluation of a model by penalizing extreme values of precision or recall. It is especially useful for imbalanced datasets.
Final Takeaway
- Precision alone can be misleading
- Recall alone can be misleading
- F1-Score balances both
- High F1-Score = truly good classification model
Metrics Comparison Table
| Metric | Formula | What It Measures | Best Used When | Not Suitable When |
| Accuracy | (TP + TN) / All | Overall correctness | Balanced data | Imbalanced data |
| Precision | TP / (TP + FP) | Quality of YES predictions | False positives are costly | Missing positives is costly |
| Recall | TP / (TP + FN) | Coverage of actual positives | False negatives are dangerous | False alarms are costly |
| F1-Score | 2PR / (P + R) | Balance of precision & recall | Both FP & FN matter | One metric is clearly more important |
Summary
2. Accuracy – “How many predictions were correct?”
What Accuracy Tells Us
Accuracy measures:
Overall correctness of the model
It counts:
- Correct YES predictions
- Correct NO predictions
and ignores:
- Which class was more important
When Accuracy Is Good
Use accuracy when:
- Dataset is balanced
- Both types of errors are equally serious
Example:
- Student pass/fail prediction
- Balanced exam datasets
When Accuracy Fails
Accuracy is misleading when:
- One class dominates (95% NO, 5% YES)
- Errors have different costs
Key lesson:
High accuracy does NOT guarantee a good model.
3. Precision – “Can I trust YES predictions?”
What Precision Measures
Precision focuses on:
How correct the model’s YES predictions are
It answers:
“When the model says YES, is it right?”
When Precision Is Most Important
Use precision when:
- False positives are costly or harmful
Examples:
- Spam filters (don’t block real emails)
- Loan approval (don’t approve bad loans)
- Product recommendations (avoid irrelevant items)
When Precision Is Not Enough
Precision ignores:
- Missed positive cases
So:
- High precision does not mean high usefulness
Key lesson:
Precision = confidence in YES predictions.
4. Recall – “Did we find all the important cases?”
What Recall Measures
Recall focuses on:
How many actual YES cases the model found
It answers:
“Out of all real positives, how many did we catch?”
When Recall Is Critical
Use recall when:
- Missing a case is dangerous
Examples:
- Medical diagnosis
- Cancer screening
- Fraud detection
- Security systems
When Recall Alone Is Dangerous
Recall ignores:
- How many false alarms occurred
So:
- High recall can create panic and waste
Key lesson:
Recall = coverage of important cases.
5. F1-Score – “Is the model balanced?”
What F1-Score Measures
F1-Score combines:
- Precision (quality)
- Recall (coverage)
It gives:
One balanced score
When F1-Score Is Best
Use F1-Score when:
- Dataset is imbalanced
- Both FP and FN matter
- You need a single comparison metric
Examples:
- Spam detection
- NLP tasks
- ML competitions
When F1-Score Is Not Ideal
Avoid F1-Score when:
- One metric is clearly more important
(e.g., only recall matters in cancer screening)
Key lesson:
F1-Score punishes imbalance and rewards balance.
6. Applications Summary
| Application | Biggest Risk | Best Metric |
| Cancer detection | Missing disease | Recall |
| Spam filter | Blocking real emails | Precision |
| Loan approval | Approving risky customer | Precision |
| Fraud detection | Missing fraud | Recall |
| Recommendation system | Poor quality suggestions | Precision |
| General ML evaluation | Balanced performance | F1-Score |