
🔹 Elbow Method
Steps:
- Choose K = 1 to 20
- Run K-Means for each K
- Calculate WCSS for each K
- Plot K vs WCSS
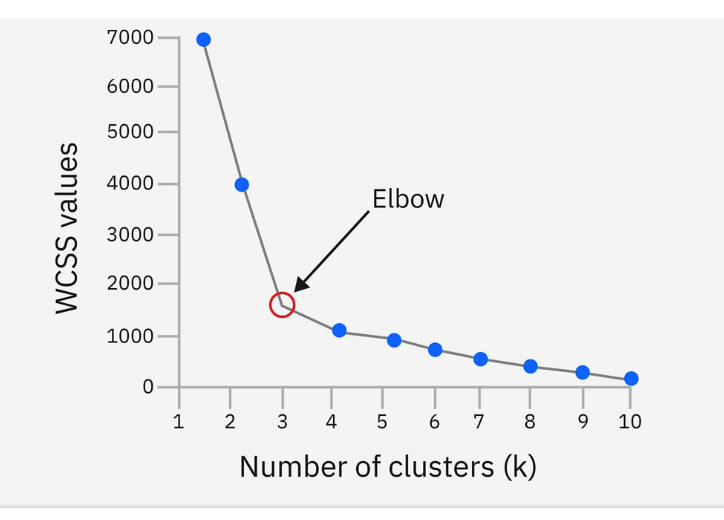
Observation:
- WCSS decreases as K increases
- At some point, decrease becomes slow
- That point looks like an elbow
👉 That K value is the optimal K
In your slide:
- Elbow occurs at K = 4
For example,
Imagine we have 5 data points:
x1,x2,x3,x4,x5
✅ CASE 1: When K = 1
There is only one centroid, call it:
c1
So ALL points belong to the same cluster.
✔ WCSS formula for K = 1:
WCSS = (x1-c1)2+(x2-c1)2+(x3-c1)2+(x4-c1)2+(x5-c1)2
Everything is measured from the same centroid.
➡️ Distances are large → WCSS is large.
✅ CASE 2: When K = 2
Now we have two centroids:
c1 and c2
Points will get divided into two clusters:
- Points closer to c₁ go to Cluster 1
- Points closer to c₂ go to Cluster 2
Let’s assume the points get divided like this:
Cluster 1:
x1,x2,x3
Cluster 2:
x4,x5
✔ WCSS formula for K = 2:
WCSS= (x1-c1)2+(x2-c1)2+(x3-c1)2⏟Cluster 1 contribution +(x4-c2)2+(x5-c2)2⏟Cluster 2 contribution
So now distances are measured from two different centroids, depending on which one is closer.
➡️ Distances are smaller → WCSS becomes smaller.
In K-Means, the distance used inside the WCSS formula is Euclidean Distance (the straight-line distance).
✅ Euclidean Distance Formula
For a point x=x2and a centroid c=c2:
dc=(x1-c1)2+(x2-c2)2
But in WCSS we square the distance, so the square root disappears:
d(xc)2=(x1-c1)2+(x2-c2)2,
This squared distance is what goes into the WCSS formula.
Our data
Take 5 points on a number line:
x1=1, x2=2, x3=8, x4=9, x5=10
Case 1: K = 1
Only one cluster, with one centroid c1.
For K-Means, the centroid is the mean of all points:
c1=1+2+8+9+105=305=6
Now compute squared Euclidean distance of each point from 6:
(x1-c1)2 =(1-6)2=25 (x2-c1)2 =(2-6)2=16 (x3-c1)2 =(8-6)2=4 (x4-c1)2 =(9-6)2=9 (x5-c1)2 =(10-6)2=16
WCSS for K = 1:
WCSS1=25+16+4+9+16=70
So when everything is pulled to one centroid at 6, total error = 70.
Case 2: K = 2
Now we allow two centroids. Clearly, the data has two groups: {1,2} and {8,9,10}.
Cluster 1: points 1 and 2
Centroid:
c1=1+22=1.5
Squared distances:
(1-1.5)2=0.25 (2-1.5)2=0.25,
Cluster-1 contribution to WCSS:
WCSSC1=0.25+0.25=0.5
Cluster 2: points 8, 9, 10
Centroid:
c2=8+9+103=273=9
Squared distances:
(8-9)2=1 (9-9)2=0 (10-9)2=1,,
Cluster-2 contribution to WCSS:
WCSSC2=1+0+1=2
Total WCSS for K = 2
WCSS2=WCSSC1+WCSSC2=0.5+2=2.5
✅ Comparison
- For K = 1: WCSS = 70
- For K = 2: WCSS = 2.5
👉 When we increased K from 1 to 2 (more centroids, points closer to nearest centroid), WCSS dropped a lot.This is exactly why the WCSS curve in the elbow method always decreases as K increases