
So far, we have measured error in absolute units such as days, marks, or rupees using MAE and RMSE. However, sometimes we want to express error in a way that is independent of scale and easy to communicate. For this purpose, we use Mean Absolute Percentage Error (MAPE).
What is MAPE?
Mean Absolute Percentage Error (MAPE) measures the average prediction error as a percentage of the actual value.
MAPE answers the question:
“On average, by what percentage is the model wrong?”
It converts error into a percentage, which people understand easily.
Why Percentage Error Is Useful
MAPE Formula
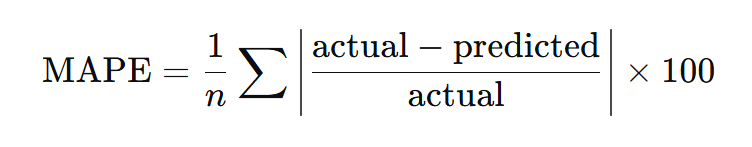
Where:
- yi= actual value
- yi= predicted value
n= number of data points
Step-by-Step Numerical Example (Stock Price Prediction)
| Stock | Actual Price (₹) | Predicted Price (₹) | Percentage Error |
| A | 100 | 110 | |100 − 110| / 100 × 100 = 10% |
| B | 200 | 190 | |200 − 190| / 200 × 100 = 5% |
| C | 500 | 480 | |500 − 480| / 500 × 100 = 4% |
Step 1: Add Percentage Errors
10+5+4=19
Step 2: Take Average
MAPE=19/3=6.33%
Interpretation of MAPE (Very Important)
MAPE = 6.33% means that, on average, the model’s predictions differ from the actual values by 6.33 percent.
This is easy to communicate:
- “Our predictions are about 6% off on average.”
Why Percentage Error Is Useful (Clear Explanation with Example)
The Core Problem with Absolute Error
Absolute error tells us:
How much the prediction is wrong in units (₹, days, marks).
But absolute error does not consider the size (scale) of the actual value.
Example: Two Products with Very Different Prices
Product A (Cheap Product)
- Actual price = ₹100
- Predicted price = ₹1,100
- Absolute error = ₹1,000
Product B (Expensive Product)
- Actual price = ₹1,00,000
- Predicted price = ₹1,01,000
- Absolute error = ₹1,000
Notice:
- Both have the same absolute error
- But their impact is completely different
Why Absolute Error Fails Here
| Product | Actual Price | Absolute Error |
|---|---|---|
| A | ₹100 | ₹1,000 |
| B | ₹1,00,000 | ₹1,000 |
If we look only at absolute error:
- Both predictions look equally bad
This is misleading.
Now Use Percentage Error (MAPE Idea)
Percentage Error Formula
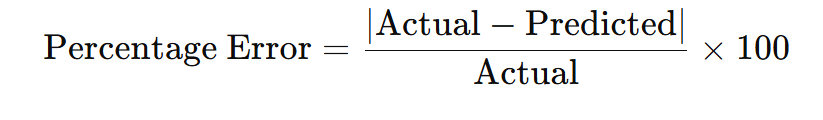
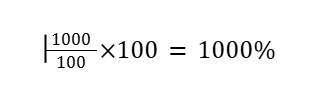
Meaning:
The prediction is 1000% wrong → extremely bad
Product B (Expensive Product)
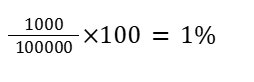
Meaning:
The prediction is only 1% wrong → very good
Why Percentage Error Solves the Problem
| Product | Absolute Error | Percentage Error | Interpretation |
| A | ₹1,000 | 1000% | Terrible prediction |
| B | ₹1,000 | 1% | Excellent prediction |
Percentage error captures relative impact, not just size.
Key Intuition
Percentage error tells us how big the mistake is relative to the actual value.
That’s why:
- Same ₹1,000 error
- Very different seriousness
Where This Is Extremely Useful
✔ Comparing products with different prices
✔ Sales forecasting across regions
✔ Revenue prediction
✔ Business reports
Advantages of MAPE
Scale-Independent (Big Advantage)
Why is this an advantage?
- MAPE works in percentages
- It does not depend on units
You can compare:
- ₹100 product vs ₹1,00,000 product
- Small company vs large company
Very Easy to Understand
People naturally understand percentages.
Example:
- “Error is 5%” → immediately clear
- “Error is ₹3,400” → unclear without context
This makes MAPE excellent for:
- Business reports
- Management presentations
Ideal for Forecasting Problems
MAPE is widely used in:
- Sales forecasting
- Demand prediction
- Revenue estimation
- Economic indicators
Forecast accuracy is often reported in percentage terms.
Good for Comparing Different Models Across Datasets
Because MAPE is relative:
- You can compare performance on different datasets
- Even if the values are on different scales
Disadvantages of MAPE
Undefined When Actual Value Is Zero (Major Problem)
If:
yi=0
Then:
∣yi-yi∣yidivision by zero
MAPE breaks completely.
Unstable for Very Small Actual Values
Example:
- Actual = 1
- Predicted = 2
Percentage error = 100%
A small absolute mistake becomes a huge percentage, which can be misleading.
Asymmetric Penalty
- Over-prediction and under-prediction are not treated equally in some cases
- Can bias evaluation
Not Suitable for All Regression Problems
MAPE should NOT be used when:
- Actual values can be zero
- Actual values are very small
- Data has many zeros
When Should We Use MAPE?
Use MAPE when:
✔ You want percentage-based interpretation
✔ Comparing performance across different scales
✔ Business communication is important
✔ Data has no zero values
When Should We Avoid MAPE?
Avoid MAPE when:
Actual values can be zero
Values are close to zero
Scientific precision matters more than relativity
In these cases, use:
- MAE
- RMSE
How to Decide Whether a MAPE Value Is Good?
Method 1: Compare with a Baseline Model
Create a simple baseline (e.g., predict average value).
| Model | MAPE |
| Baseline model | 18% |
| ML model | 6% |
Since 6% < 18%, the model is clearly good.
A MAPE is good if it significantly improves over the baseline.
Method 2: Compare Across Models
Train multiple models and compare MAPE:
| Model | MAPE |
| Linear Regression | 12% |
| Decision Tree | 8% |
| Random Forest | 6% |
Lowest MAPE → best model.
A MAPE value is considered good if it is low relative to business expectations, significantly better than a baseline model, and suitable for the given data scale.