
So far, we evaluated regression models using error-based metrics such as MAE, RMSE, and MAPE, which tell us how far predictions are from actual values. However, these metrics do not tell us how well the model explains the overall behaviour or pattern of the data. To understand how well a model fits the data, we use R-squared (R²).
R-Squared
Understanding “Variation” (Very Important)
Example: Student Marks
Suppose students scored:
40, 55, 60, 75, 90
- Marks are not constant
- They vary around the average
This spread is called total variation.
A regression model tries to:
- Capture patterns
- Reduce unexplained variation
R-Squared Formula (With Meaning)
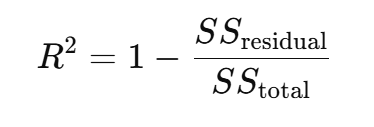
Where:
Total Sum of Squares (SSₜₒₜₐₗ)
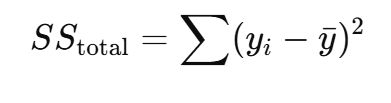
➡ Total variation in actual values
➡ Variation before using any model
Residual Sum of Squares (SSᵣₑₛ)
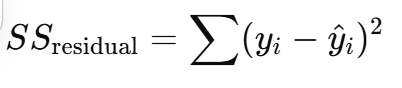
Variation not explained by the model
➡ Prediction error spread
Step-by-Step Numerical Example (Simple)
Actual Values (House Prices in lakhs)
| House | Actual Price |
| 1 | 20 |
| 2 | 30 |
| 3 | 40 |
Step 1: Mean of Actual Values
Step 1: Mean of Actual Values
yˉ=(20+30+40)/3=30
Step 2: Calculate SSₜₒₜₐₗ
| Value | Square | |
| 20 | -10 | 100 |
| 30 | 0 | 0 |
| 40 | 10 | 100 |
SStotal=100+0+100=200
Step 3: Model Predictions
| House | Actual | Predicted |
| 1 | 20 | 22 |
| 2 | 30 | 28 |
| 3 | 40 | 38 |
Step 4: Calculate SSᵣₑₛ
| Actual | Predicted | Error | Squared Error |
| 20 | 22 | -2 | 4 |
| 30 | 28 | 2 | 4 |
| 40 | 38 | 2 | 4 |
SSresidual=4+4+4=12
Step 5: Calculate R²

Interpretation of R² (Very Important)
R² = 0.94 means the model explains 94% of the variation in house prices.
Only 6% of variation remains unexplained.
Range and Meaning of R²
| R² Value | Meaning |
| 1.0 | Perfect fit |
| 0.9 | Excellent |
| 0.7 | Good |
| 0.5 | Moderate |
| 0.0 | No explanatory power |
| < 0 | Worse than predicting mean |
Negative R² means:
Model performs worse than a simple mean prediction.
Advantages and ❌ Limitations of R-Squared and Adjusted R-Squared
Advantages of R-Squared (R²)
Easy to Interpret (Very Important)
Why is this an advantage?
- R² is expressed between 0 and 1
- It can be easily converted into percentage
Example:
- R² = 0.75
- Means: 75% of the variation in output is explained by the model
Students can quickly understand:
Higher R² = better explanation of data
Scale-Independent
What does scale-independent mean?
- R² does not depend on units
- It works the same for:
- ₹ (price)
- days (delivery time)
- marks (exam score)
Example:
- Predicting house price in ₹
- Predicting temperature in °C
R² works equally well in both cases.
This makes R² universal and flexible.
Useful for Model Comparison (Same Dataset)
Why is this useful?
When comparing two models trained on the same dataset:
| Model | R² |
|---|---|
| Model A | 0.68 |
| Model B | 0.81 |
Model B explains more variation → better fit.
R² helps us choose the better-fitting model.
Limitations of R-Squared (Why It Can Mislead)
R² Always Increases When You Add Variables
(Most Important Limitation)
Why is this a problem?
Even if we add:
- Shoe size
- Random number
- Student roll number
R² will still increase slightly.
Example:
- Model A: uses house size → R² = 0.80
- Model B: adds owner’s shoe size → R² = 0.82
Shoe size has no real meaning, but R² increased.
This gives false confidence and leads to overfitting.
R² Does NOT Measure Prediction Accuracy
Common student mistake:
“High R² means low error”
This is NOT always true.
Example:
- Model explains trend well (high R²)
- But individual predictions are far from actual values
You can have:
- High R²
- High MAE / RMSE
That’s why:
R² must be used with error metrics
Not Reliable for Non-Linear Models
Why?
R² assumes:
- Linear relationship
- Straight-line fitting
For models like:
- Decision Trees
- Random Forests
- Neural Networks
R² may:
- Look misleading
- Fail to reflect true performance
R² is mainly suitable for linear regression.
Adjusted R-Squared
Adjusted R-Squared
Why R-Squared Alone Is Not Enough
So far, we learned that R-squared (R²) tells us:
“How much of the variation in the output is explained by the model.”
This is useful, but it has a serious problem.
he Problem with R-Squared (Recall)
R² always increases when we add more input variables(input feature),
even if those variables(Features) are meaningless.
Example:
- Predicting house price using:
- Area → meaningful
- Shoe size → meaningless
Still:
- R² increases slightly
This can:
- Mislead us
- Encourage overfitting
- Give false confidence
If R² always increases, how do we know whether a new variable is actually useful?”
This question leads us directly to Adjusted R-Squared.
What is Adjusted R-Squared?
Adjusted R-Squared is an improved version of R² that:
Rewards useful variables and penalizes useless ones.
In simple words:
- R² asks: How well does the model fit?
- Adjusted R² asks: Is this fit worth the added complexity?
Why “Adjustment” Is Needed (Intuition)
When we add a new variable:
- It may improve prediction
- Or just add noise
Adjusted R² checks:
“Did this variable genuinely improve the model?”
If:
- Yes → Adjusted R² increases
- No → Adjusted R² decreases
Adjusted R-Squared Formula
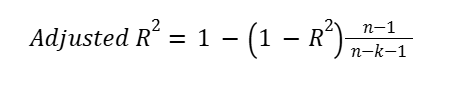
Where:
- n= number of data points
- k= number of predictors
Key idea:
- More predictors → bigger penalty
- More data → smaller penalty
Step-by-Step Numerical Example
Case: Predicting House Price
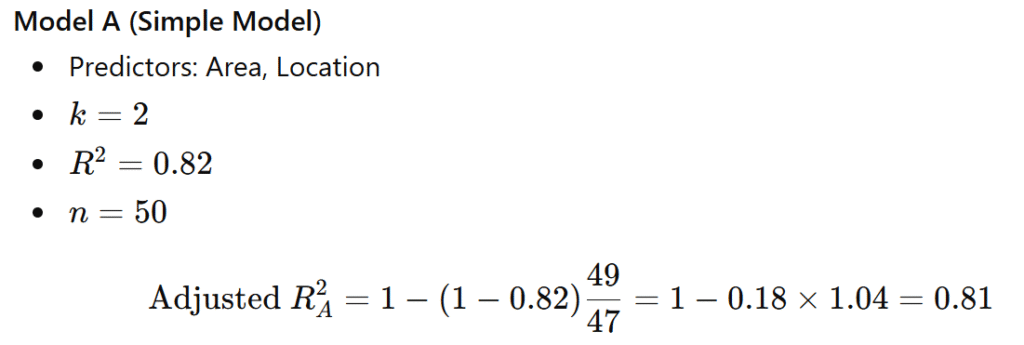
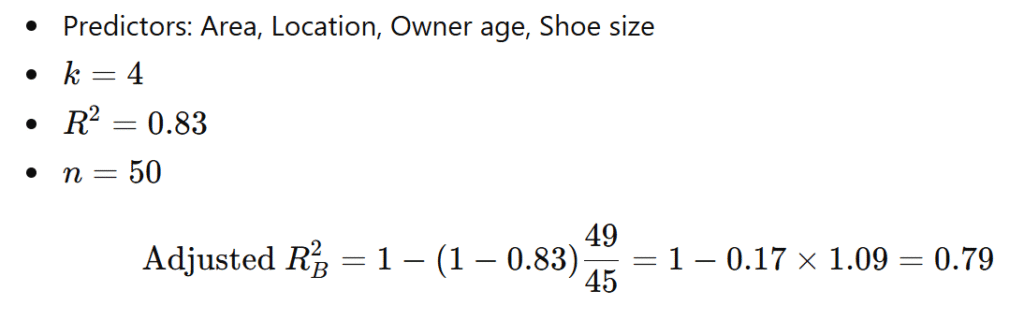
Model B (Complex Model)
Comparison
| Model | R² | Adjusted R² |
| Model A | 0.82 | 0.81 |
| Model B | 0.83 | 0.79 |
Even though R² increased, Adjusted R² dropped.
Model A is better.
Interpretation of Adjusted R-Squared
Adjusted R² represents the proportion of variance explained by the model after accounting for the number of predictors used.
It balances:
- Accuracy
- Simplicity
Advantages of Adjusted R-Squared (Explained)
Penalizes Overfitting
- Discourages adding useless features
- Promotes meaningful predictors
Fair Model Comparison
- Compares models with different numbers of variables
- R² cannot do this reliably
Encourages Simpler Models
- Supports Occam’s Razor:
Simpler models are preferred when performance is similar.
Limitations of Adjusted R-Squared
Still Does Not Measure Error Size
- Does not tell:
- How far predictions are from actual values
Must be used with:
- MAE
- RMSE
Slightly More Complex to Understand
- Formula is more complex than R²
- But concept is simple: penalize extra variables
When to Use Adjusted R-Squared
Use Adjusted R² when:
✔ Multiple predictors are involved
✔ Comparing models with different complexity
✔ Feature selection matters
When to Use R-Squared Instead
Use R² when:
✔ Simple linear regression
✔ Only one predictor
✔ Teaching basic concept
R-Squared vs Adjusted R-Squared (Quick Summary)
| Aspect | R² | Adjusted R² |
| Measures fit | Yes | Yes |
| Penalizes extra variables | No | Yes |
| Always increases | Yes | No |
| Best for | Simple models | Multiple models |
R² measures fit; Adjusted R² measures fit with fairness.